# PromQL for Beginners: Getting Started With Prometheus

## Metadata
- Author: [[Gabriel Diaz]]
- Full Title: PromQL for Beginners: Getting Started With Prometheus
- Category: #articles
- Summary: PromQL is a query language used with Prometheus to retrieve and analyze time-series data. It helps you monitor system metrics by writing simple or complex queries with filters and functions. PromQL is useful for real-time monitoring, alerting, and optimizing system performance.
- URL: https://last9.io/blog/promql-for-beginners-getting-started-with-prometheus-query-language/
## Highlights
- What is PromQL?
PromQL is a query language designed to work with time series data, allowing you to select and aggregate data in real time. It’s used for both graphing and alerting in Prometheus. ([View Highlight](https://read.readwise.io/read/01kwsmrwhchgxwpjybedv9hyrr))
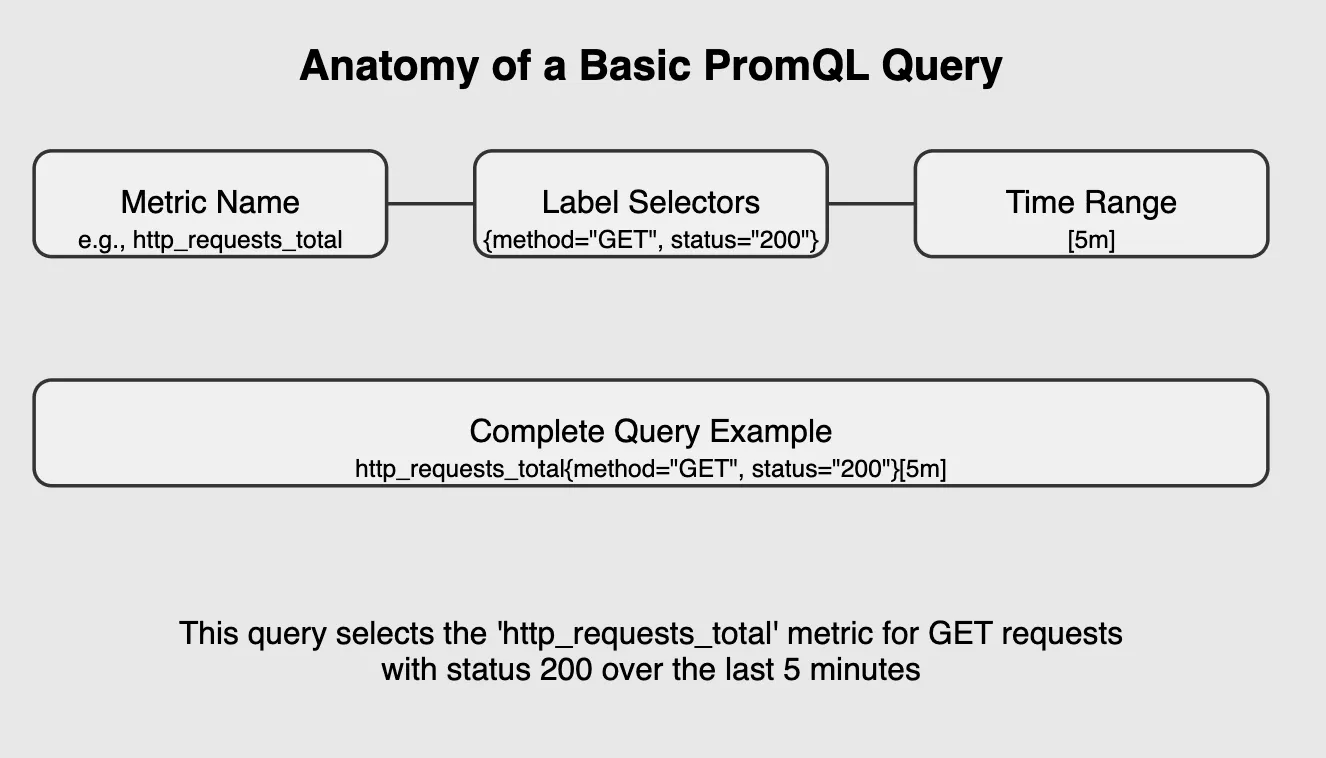
- PromQL Structure
 ([View Highlight](https://read.readwise.io/read/01kwsmtedr1dn1b9e5284jg0y6))
- **Metric Name**: This is the name of the metric you want to query, such as `http_requests_total`
**Label Selectors**: These allow you to filter the metric based on specific labels, like `method="GET"` and `status="200"`
**Time Range** This optional component specifies the time range for the query, such as `[5m]` for the last 5 minutes. In the example query: ([View Highlight](https://read.readwise.io/read/01kwsmv1we4dtgdmf92157vzbt))
- Simple Queries
The most basic PromQL query is just the name of a metric:
http_requests_total
Basic PromQL Query
This returns the *current* value of the `http_requests_total` metric for all monitored endpoints. ([View Highlight](https://read.readwise.io/read/01kwsn9nwpzxy86f3yd97qkajk))
- Note: This shows every endpoint / label
- Label Matchers
You can filter metrics using label matchers:
http_requests_total{status="200", method="GET"}
Filter a metric for GET endpoints and status 200
This query selects only the HTTP requests with a status code of 200 and a GET method. ([View Highlight](https://read.readwise.io/read/01kwsy9b2ss9qpfx0jad9pse0q))
- Range Vectors
To query data over time, use range vectors:
http_requests_total[5m]
This returns all values of `http_requests_total` over the last 5 minutes. ([View Highlight](https://read.readwise.io/read/01kwsy9yvbhk0rd5wpe9s15vbp))
- Basic Functions
PromQL provides various functions to work with data:
1. `rate()`: Calculate the per-second rate of increase
rate(http_requests_total[5m])
2. `sum()`: Add up values
sum(http_requests_total)
3. `avg()`: Calculate average
avg(node_cpu_utilization) ([View Highlight](https://read.readwise.io/read/01kwsyaneryjq04p59n6wz2qm7))
- 1. **Counter**
Counters are metrics that can only increase over time (they may reset to zero on application restarts or other specific events).
They’re commonly used to track things like the number of requests handled by a service or the number of bytes transmitted over a network.
**Example Use Case:**
• Tracking the total number of HTTP requests received by a web server.
**PromQL Query Example:**
rate(http_requests_total[5m])
This query returns the rate of HTTP requests per second over the last 5 minutes. ([View Highlight](https://read.readwise.io/read/01kwsycnmxrk396qwe32v3fy7e))
- 2. **Gauge**
Gauges are metrics that can go up or down, allowing them to represent values that fluctuate over time, such as temperature, memory usage, or CPU load. A gauge can be used to track instantaneous values that aren’t necessarily increasing.
**Example Use Case:**
• Monitoring system memory usage or CPU load.
**PromQL Query Example:**
avg(node_memory_MemAvailable_bytes[5m])
This query gives the average available memory over the last 5 minutes. ([View Highlight](https://read.readwise.io/read/01kwsyftamjta8cn2rgq9363eh))
- 3. **Histogram**
Histograms are metrics that track the distribution of data across different “buckets.” They are used to record the frequency of occurrences of events in specified ranges, making them ideal for latency or duration measurements. Histograms are often used in Prometheus to capture request durations or response sizes.
Histograms consist of two components:
• **Buckets**: They represent ranges of values.
• **Sum**: The total sum of observed values.
• **Count**: The total number of observations.
**Example Use Case:**
• Measuring the distribution of request durations.
**PromQL Query Example:**
histogram_quantile(0.95, rate(http_request_duration_seconds_bucket[5m])) ([View Highlight](https://read.readwise.io/read/01kwsyhs8f6x2f82qvvfgmszgx))
- 4. **Aggregation Operators**
Aggregation operators allow you to combine multiple time series into a single value, typically by applying a function like sum, average, max, or count.
• **sum()**: Calculates the sum of values across time series.
• **avg()**: Calculates the average of values across time series.
• **min()**: Finds the minimum value across time series.
• **max()**: Finds the maximum value across time series.
• **count()**: Counts the number of time series.
**Example Use Case:**
• Aggregating data to see the total number of requests across multiple instances.
**PromQL Query Example:**
sum(http_requests_total) by (status) ([View Highlight](https://read.readwise.io/read/01kwtfnrvepx3w0x6t35y2bwbz))
- Note: Aggregates across your choice of label, and displays final value for each
- 1. **Real-Time Monitoring and Dashboards**
PromQL allows you to craft custom queries that provide real-time insights into your system’s health.
Whether you’re tracking HTTP request rates, CPU utilization, or memory usage, you can create dashboards that give you a clear picture of your infrastructure’s current state. ([View Highlight](https://read.readwise.io/read/01kwtfzy713b0yd876vj2c5k8j))
- 3. **Anomaly Detection**
One of the most powerful uses of PromQL is anomaly detection. By using PromQL to compare current metrics to historical baselines, you can automatically detect when something is out of the ordinary.
For example, if the CPU usage of a service spikes beyond its usual range, PromQL can help identify this anomaly quickly, alerting you before it turns into a bigger issue. ([View Highlight](https://read.readwise.io/read/01kwtg0qtkdwnezjp0c4v5bnmy))
- 4. **Alerting and Incident Response**
PromQL plays a key role in defining alerting rules in Prometheus. You can use it to set thresholds for various metrics, such as high response times or low available memory, and create alerts when those conditions are met. ([View Highlight](https://read.readwise.io/read/01kwtg13y0zhdrckxz25nah6ha))
- 2. **What does `=~` mean in PromQL?**
In PromQL, `=~` is the regular expression matching operator. It is used to match label values against a regular expression pattern. For example, if you want to match a status code label that starts with “5”, you can use `=~` like this:
http_requests_total{status=~"5.*"}
This would match all status codes starting with 5, such as 500, 503, etc. ([View Highlight](https://read.readwise.io/read/01kwtg46p9r1s0f0vd4fk8p1ws))
- 3. **What type of databases does PromQL work with?**
PromQL is specifically designed to work with Prometheus, a time-series database. Prometheus stores and queries time-series data (metrics), but PromQL is not used with traditional relational databases like MySQL or PostgreSQL. ([View Highlight](https://read.readwise.io/read/01kwtg4z3fgppm47zavzhwhhmy))
- It’s used to query metrics, set up alerts, and integrate with visualization tools like **Grafana**. ([View Highlight](https://read.readwise.io/read/01kwtg646x7bbq2he0bvzkj875))
- 9. **What is Grafana?**
Grafana is an open-source visualization and monitoring tool used to visualize time-series data, including data from Prometheus. It integrates with Prometheus and other data sources, allowing you to create dashboards, graphs, and alerts to monitor the health and performance of your systems. ([View Highlight](https://read.readwise.io/read/01kwtg7g5tdnewvz0x08n2wxnp))