# Logging, Tracing, and Metrics
## Metadata
- Author: [[ByteByteGo]]
- Full Title: Logging, Tracing, and Metrics
- Category: #articles
- Summary: Logging records individual events in a system to help track activities. Tracing follows user requests across services to find performance issues. Metrics collect and analyze system data to monitor health and trigger alerts.
- URL: https://bytebytego.com/guides/logging-tracing-metrics/
## Highlights
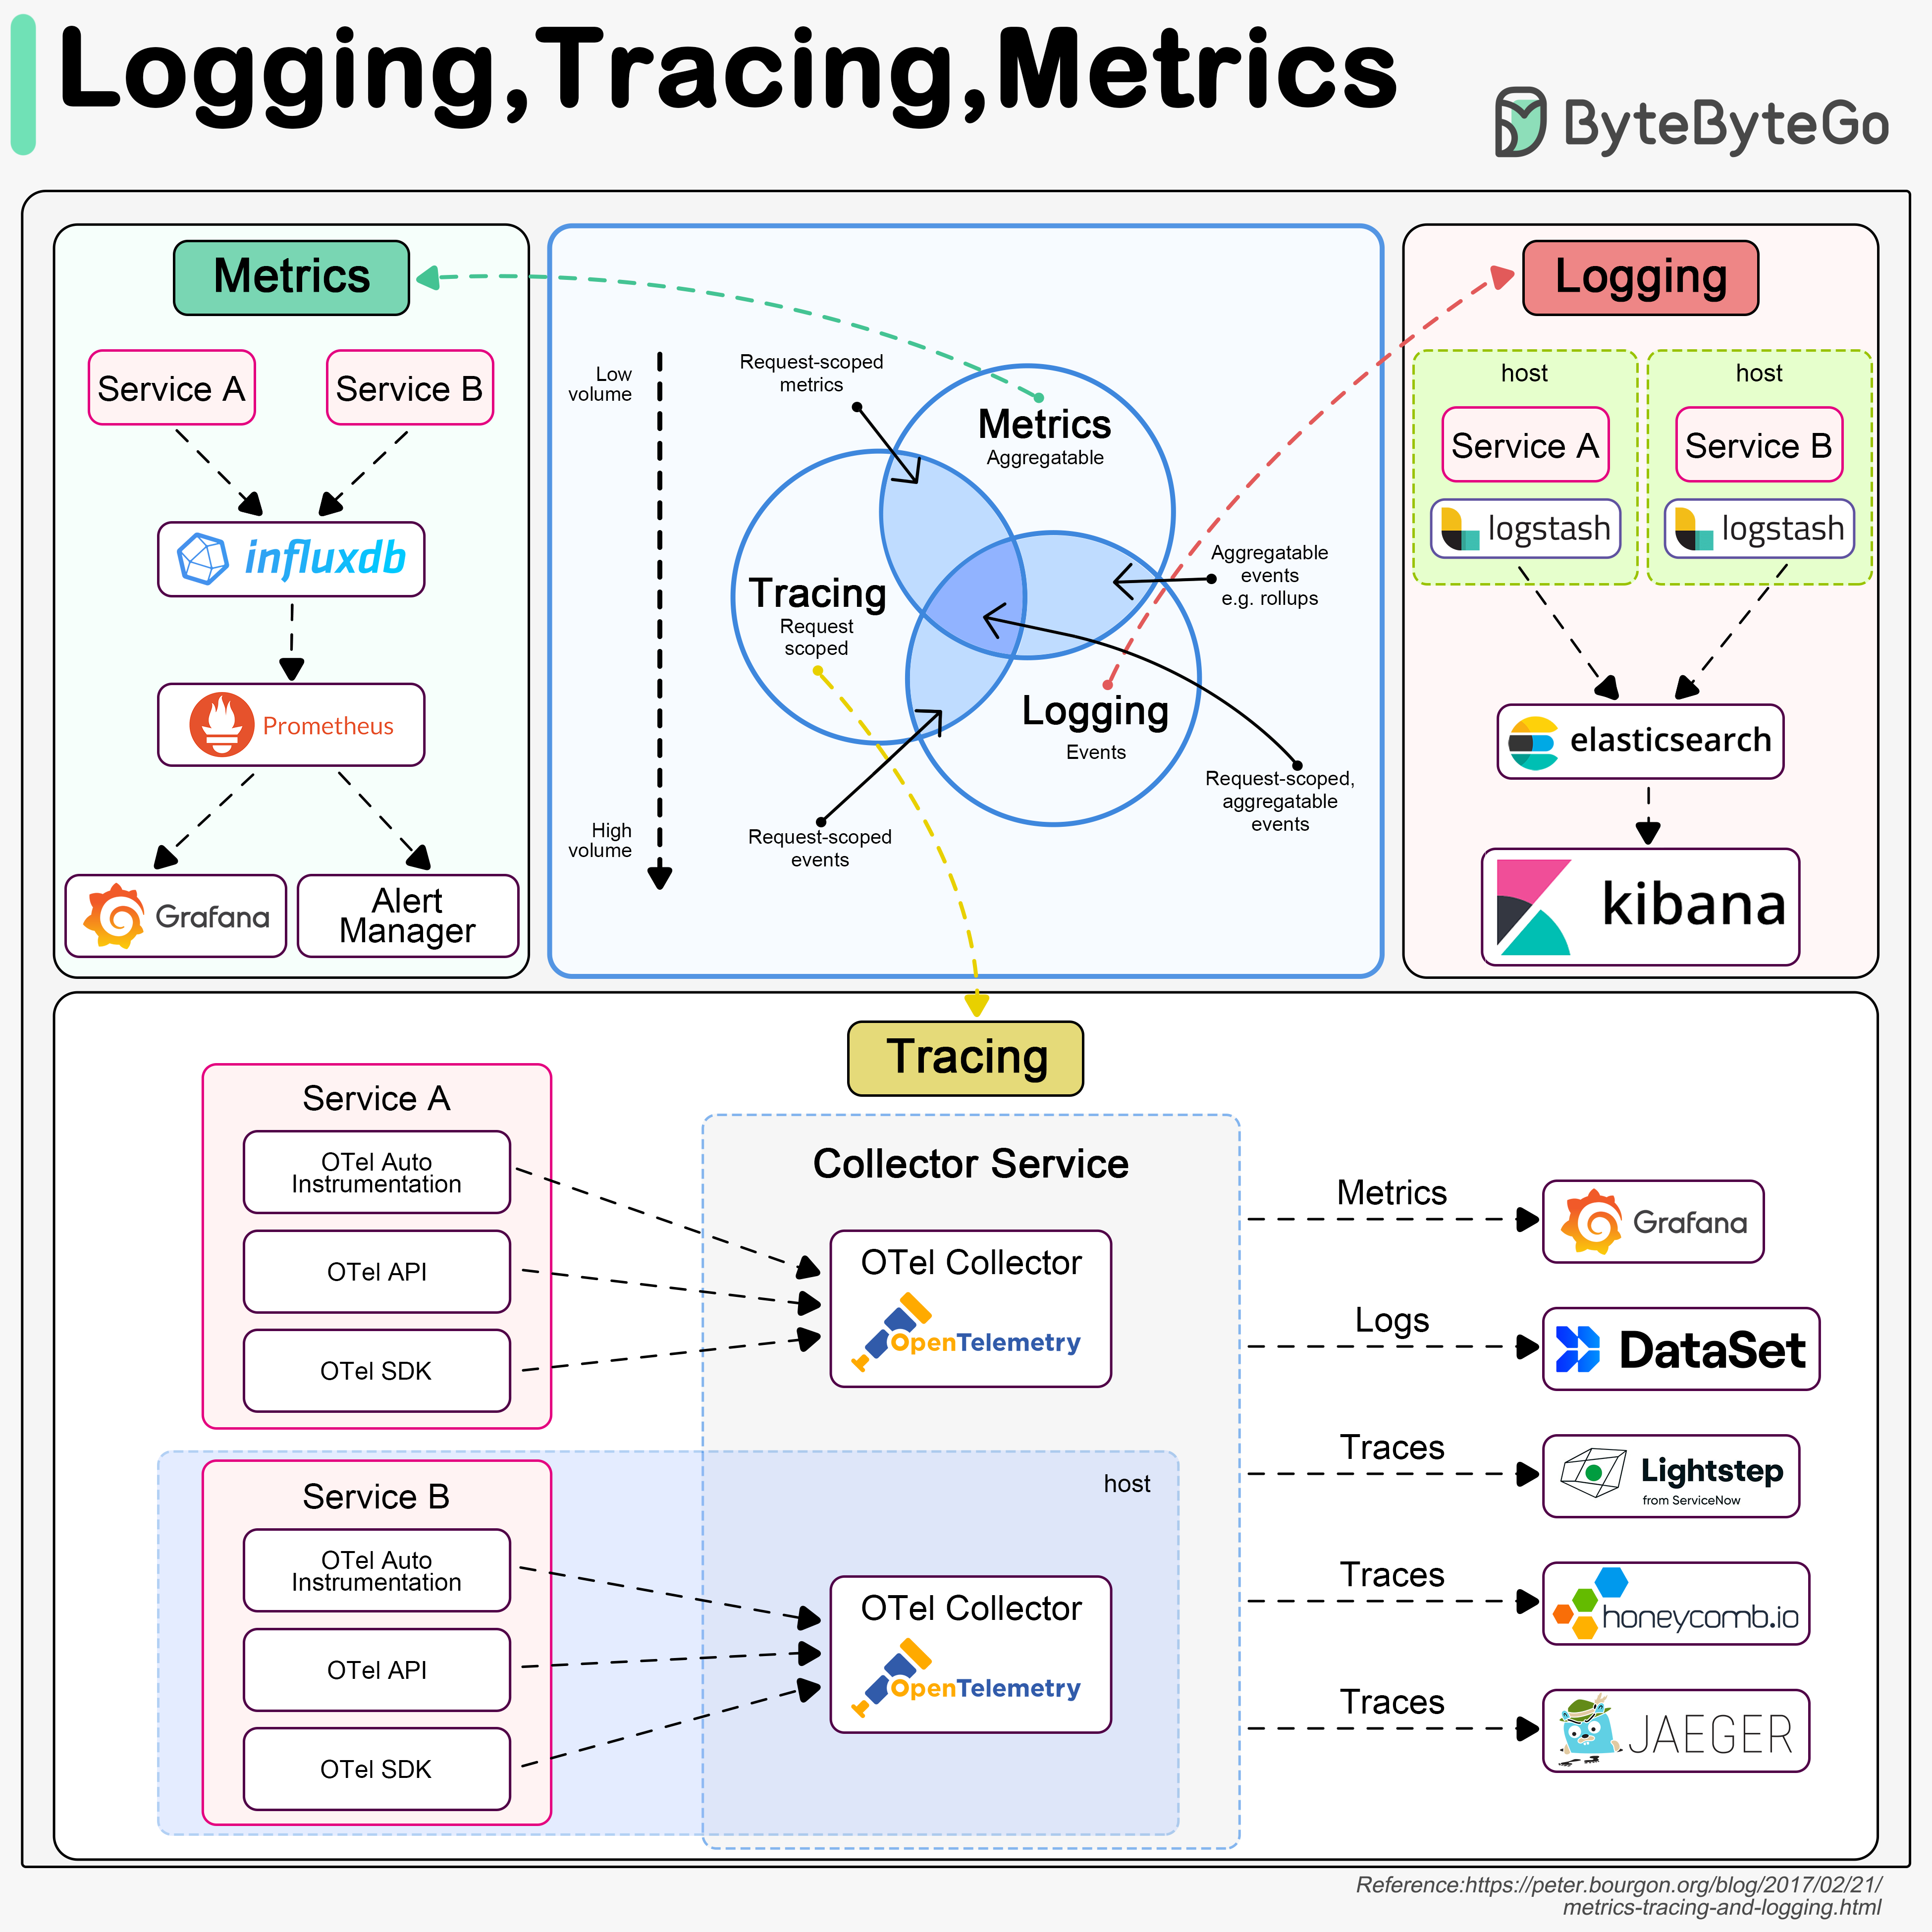
- Logging, tracing, and metrics are 3 pillars of system observability. The diagram below shows their definitions and typical architectures. ([View Highlight](https://read.readwise.io/read/01kwth4z7ha3ta3gxqtz8he1qr))
-  ([View Highlight](https://read.readwise.io/read/01kwth4trdb8scpxan7dcmh094))
- Logging
Logging records discrete events in the system. For example, we can record an incoming request or a visit to databases as events. It has the highest volume. ([View Highlight](https://read.readwise.io/read/01kwth5tj3fe1bwzq05beb6zkt))
- Tracing
Tracing is usually request-scoped. For example, a user request goes through the API gateway, load balancer, service A, service B, and database, which can be visualized in the tracing systems. ([View Highlight](https://read.readwise.io/read/01kwth69x8xrne591m3zfgg3mm))
- Metrics
Metrics are usually aggregatable information from the system. For example, service QPS, API responsiveness, service latency, etc. The raw data is recorded in time-series databases like InfluxDB. Prometheus pulls the data and transforms the data based on pre-defined alerting rules. Then the data is sent to Grafana for display or to the alert manager which then sends out email, SMS, or Slack notifications or alerts. ([View Highlight](https://read.readwise.io/read/01kwth71kccamskat7v45v06tj))